November 2018 | Point of View
A 3-step process to identify the metrics that matter
In today’s environment, any critical business decision not backed by data-driven insights is subject to extra scrutiny.
A 3-step process to identify the metrics that matter
While every organization strives to evolve and improve its business decision-making, initiating a program of trustworthy, credible and accessible data to drive those decisions comes with high barriers to entry. There are several common challenges that prevent organizations from increasing visibility and making better business decisions by leveraging data:
-
Lack of clarity: Business functions are reactive, tackling the “issue of the month,” without an overall vision of their function-specific critical metrics or key performance indicators.
-
Low cross-functional business alignment: Each function operates in a silo for its data and reporting needs, with limited clarity of how the function serves the overall organization.
-
Disparate systems: Data is poorly aligned and inconsistent across core business applications with no single source of truth and poor integration among systems.
-
Limited ownership and data governance: Ownership of key master data such as information about customers or pricing is limited; a formal data-governance process is absent.
If all or some of the points above are true for your organization, it can seem overwhelming to determine where to start. And improving on these areas will be a transformational journey, not a single project. Even so, every organization needs to begin somewhere. Here are three steps any team can use to immediately begin improving operational visibility without a costly investment in new technology:
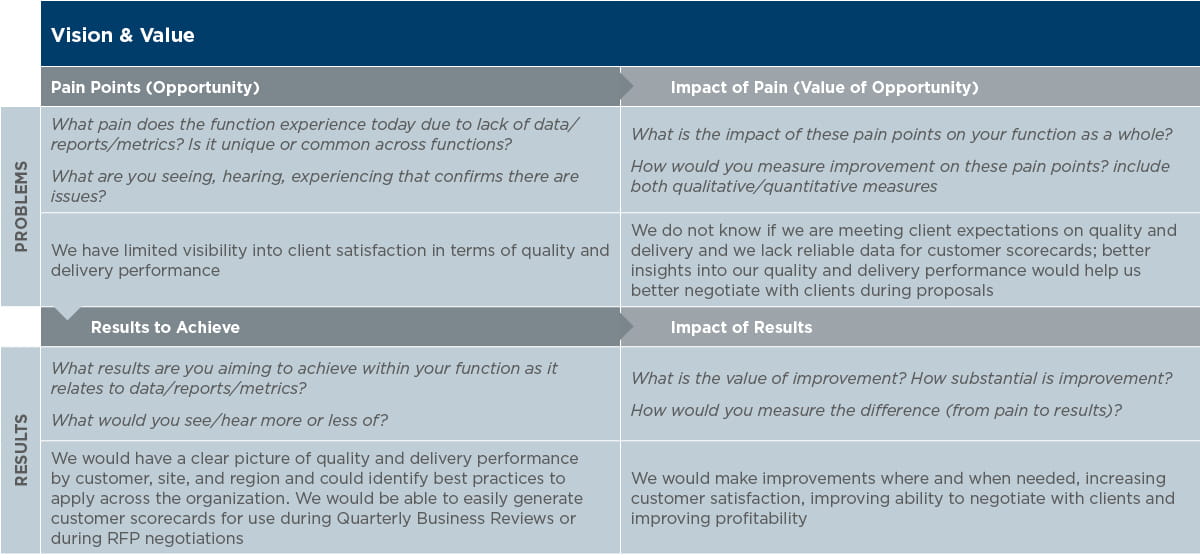
Step 1: Determine Vision & Value Across Functions
Within each core business function, be it sales, operations, finance, human resources or something else, start by holding workshops to discuss the value drivers within the function. Articulate what the future state for being “data-driven” means within each function. To gather key insights, perform a simple exercise of plotting current data and visibility pain points and their subsequent impact to the business, while defining the results the team is working toward and what the impact of those results will be.
Based on the information gathered above, determine the overall business objective that best aligns with the area of opportunity. Then, discuss and align on a single key performance indicator that could be leveraged to measure results.

Repeat this process for the critical pain points, and then prioritize two to three key measurements within each function. Once all functions have completed their workshops, come together for a cross-functional workshop to discuss what the functions have in common. Use the time to align on a list of eight to 10 key performance indicators that the business can agree will drive improved firm-wide data-driven decision making.
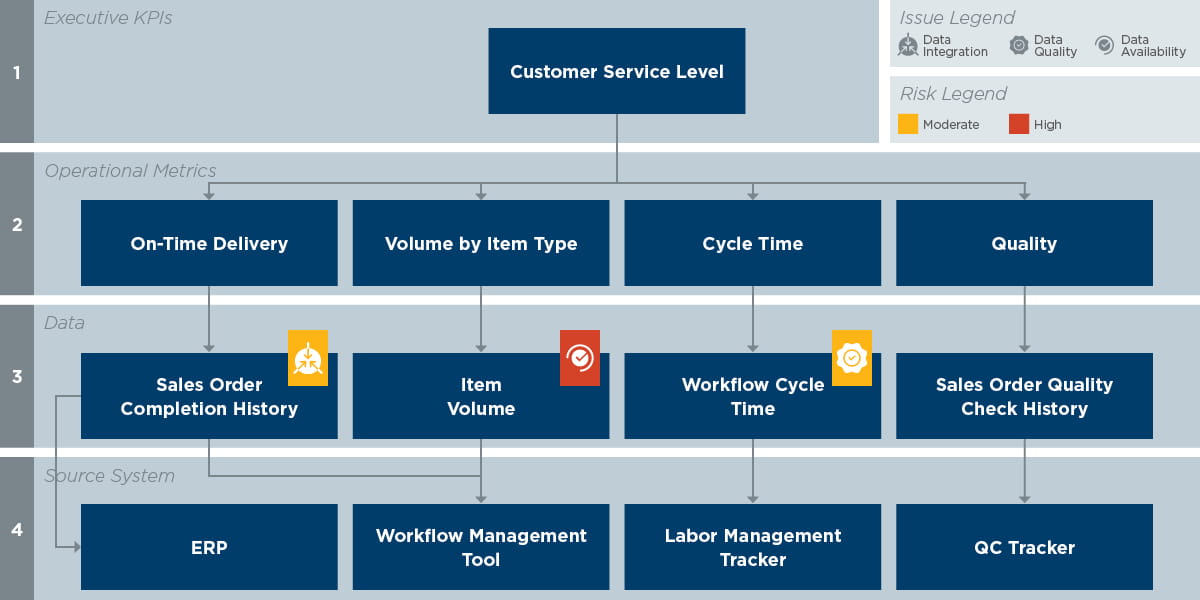
Step 2: Perform Detailed Gap Analysis and Map KPI Trees
Once the list of firmwide KPIs is documented, it is critical to perform a detailed analysis to determine existing gaps preventing the KPI from being measured. These can be people gaps (lack of ownership), process gaps (inconsistent ways of gathering data), or technology gaps (no mechanism to track data required). The easiest way to efficiently gather and discuss gaps is to create a KPI tree.
To create a KPI tree, start by defining the underlying operational metrics that are required to calculate the performance indicator. From there, define the data elements required to calculate each metric. Finally, map the data elements to their source system. This framework is a great facilitation tool to discuss and document known gaps. Use a legend to highlight specific concerns such as data integration issues, data quality issues, or data availability issues. Drive downstream prioritization by ranking each issue with a related risk.
Generate KPI trees for all prioritized cross-functional performance indicators. Once complete, your organization will have much greater clarity surrounding the root cause of issues and what is needed to eliminate gaps. This is also an opportune time to identify “quick-wins:” KPIs or operational metrics that are available to the business today but are under-leveraged or ineffectively managed. Take the time to highlight these quick-win opportunities and pursue action.
Step 3: Plot the Journey Forward
For each KPI, there will be a journey to optimization that takes shape based on the analysis. While it is rare that any critical performance indicator is instantly trusted and precisely measured, it is critical to begin with the end in mind, looking at what actions are needed now to create a realistic, fully optimized end state.
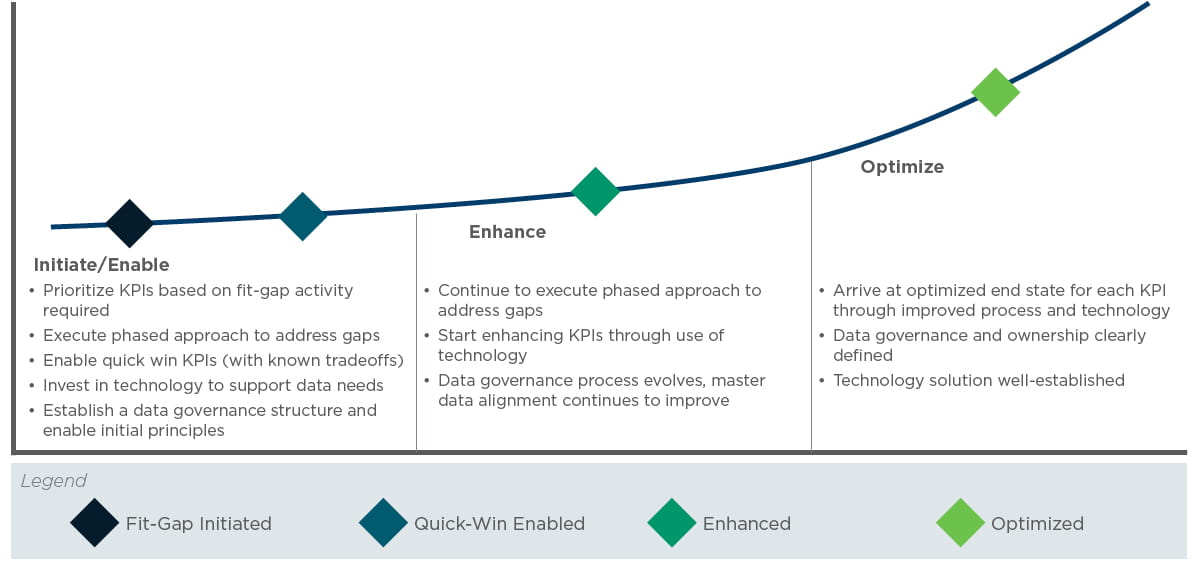
For each KPI, initiate the activities required to close the gaps as soon as possible. Focus on actions that will enable quick wins while keeping the end state in mind. Continue the path toward enhancement through gap closure, enhancing KPI generation through technology, and making further investments in data governance. Finally, you will reach the optimized end state. Even as this could be months or years after initiation, the result will be worth the investment of time and resources.
These three steps are intended to jump-start improved operational visibility within your organization. The benefits of following this process are directly aligned to the common issues discussed at the beginning:
- Improved clarity on business and data issues and that are preventing progress
- Aligned cross-functional teams following a common set of key metrics required to drive visibility
- Documented understanding of underlying data needs and areas of focus to continually improve
- Enhanced cross-functional collaboration and ownership of the data and processes required to generate KPIs
All of this can be achieved without a major investment in a ‘new shiny object’ or an expensive technology solution. It is not too good to be true.

