June 11, 2018 | InBrief
When design thinking meets data science
When design thinking meets data science
In the world of big data and predictive analytics the standard approach for gathering and analyzing data follows the CRISP-DM approach. While the CRISP-DM model has been a good approach on which to structure many projects, it suffers from the same issues waterfall-style requirements gathering approaches to software design have suffered from, including:
- Longer time to understand the problem/solution space
- Lack of applicability to real world needs
- Steep learning curve for the business to understand insights and apply them to the business
The CRISP-DM approach has become standard, and has been long used unchallenged or unchanged. Yet, as new ways of thinking about gathering requirements for predictive analytics emerge, sometimes it just takes a step back from today’s standards to see a new perspective. This was the case, when a recent data science graduate presented a variant to the CRISP-DM requirements gathering method, suggesting instead of building understanding with users by deploying a method of visual representation to help in defining the data and the output. This innovative approach, called Design Thinking Methodology, could prove to be invaluable in scenarios where requirements gathering doesn’t quite fit in the standard model.
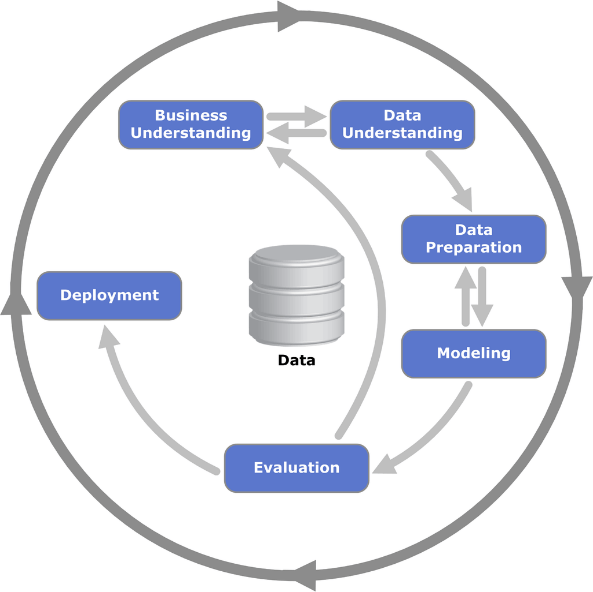
Current CRISP-DM approach:
The approach many data science professionals use today when gathering requirements for predictive analytics solutions involves a variant of cross-industry standard process for data mining. This standard approach, called CRISP-DM, follows an iterative pattern that takes an abstract understanding of a business space and then seeks to understand the underlying data, then prepare, model, evaluate, and deploy the data solution.
This process provides a strong framework to define the way data science professionals attack the data mining exercise, but the process is a bit vague when it comes to defining exactly how users interacts with the data solution, including how business users will experience and use data insights. Overall, the structure provided by CRISP-DM works well in common data mining scenarios, but when the approach is leveraged in all situations, it may falsely identify what problem to solve, and in fact may even mask where the client could be looking for help.
Design Thinking Methodology:
To avoid the pitfalls of applying a framework to the non-ideal situation, big data and predictive analytics solutions could benefit by taking a cue from other movements in the technology field. Using the same principles as other software projects, big data and predictive analytics could benefit by starting with design up front, as a way to understand how the business will use the insights. Moreover, starting with design will orient the problem space, thereby highlighting additional requirements for developing the technical data solution, with the right business case in mind.
This approach, Design Thinking methodology, starts by representing the workflow or ways business users will use the data and interact with insights visually. These types of requirements could be captured using story boards or workflow representation and user narratives. Once documented, a variety of sketching techniques could be used to provide context for the users regarding how the data space might be designed. For example, a visual data model can be shown including a representation of the relationships of data elements as the users understands them. Presenting the relationships visually based on the business perspective, will identify both perceived and existing relationships that can be tested, as well as help develop narratives depicting how the data insight would be leveraged by downstream systems or analysis, which really helps keep the end results in mind.
Understanding how business users will interact and use the data insights, is key in reaching a successful solution. In fact, famous American engineer, businessman, and inventor, Charles Kettering, once said, “A problem well-stated is a problem half-solved.” The same can be applied for targeting your client’s business needs. By applying Design Thinking methodology to the traditional CRISP-DM approach, the success rate of a data science project (which sits at a lackluster 13%) stands to improve by 5-10x.
The most common reasons why data science projects fail can be attributed to asking the wrong questions during exploratory analysis, using faulty data and experiencing environmental shortcomings, the inability to achieve end-user buy in, and an overall lack of diverse expertise. Employing Design Thinking methodology stands to curve all of these fatal project flaws by shifting the impetus from a strictly data technology project, to a business project enabled by technology.
There are three stages to the Design Thinking methodology that shift the paradigm of data science projects from a failed attempt to a huge success:
- Deploying Deep Empathy for the Customer
- Going Broad to Go Narrow
- Rapid Experiments with the Customer.
Deep Customer Empathy:
To be a design thinking data scientist is to be a product manager (whether the product be an integrated dashboard or a recommendation decision engine) that seeks to satisfy a diverse set of customers. But before that can occur, the data scientist needs to interview and observe each stakeholder to understand how they’re involved in the ecosystem of this project. If these observations are done thoroughly, the data scientist will:
- Understand the people for whom the project is being created
- Have a better definition of the problem they are solving for
- An understanding of the environment which the solution will exist in
- Criteria for what a good solution might look like, and how it will be leveraged by various users
It’s critical to keep an open mind throughout this process and not to fall into the trap of projecting a solution before developing a full understanding of the problem. Upon the completion of the Deep Customer Empathy phase, there should be five artifacts created that will help shape the rest of the Design thinking process:
- Personas (A summation of features about your varying classes of customers)
- Problem Statements (How each persona relates to the project and what their motivations or hindrances are)
- Environment (What does the current data look like? Which Systems are they using, and what processes are already in place?)
- Design Evaluation Criteria (Is it done simply and easy to use?)
- Solution Evaluation Criteria (Assurance that solution is working; testing, monitoring and alerting)
Going Broad to Go Narrow:
The second phase of the design thinking process is direct stakeholders involvement, such that they as users feel that they are part of the solution, dramatically increasing buy-in for the end-product. This is where the data scientist will bring together a diverse group of stakeholders and will facilitate a brainstorming session:
- To begin, the data scientist will set the context of the session by reviewing the 5 artifacts from phase 1 with the group, with particular emphasis on the problem statements
- Once the context is set, the facilitator should provide sticky notes and ask the group to post as many possible ideas for solutions on the wall as they possibly can within a given time constraint
- Once all ideas are posted, the facilitator will help condense the groups’ ideas into categories, and categories ultimately into a hypothesis for a potential solution to the problem statements

The group’s participation in this brain storming activity creates more of a team environment and helps the stakeholders feel more invested in the success of the product because their input has been included and potentially implemented into the final solution.
Rapid Experiments with the Customer:
Based off of the solution hypothesis developed by the diverse customer group in the brainstorming activities, the data scientist can begin going to work on creating iterative prototypes of the solution that will be vetted for stakeholder feedback. It’s suggested to create paper prototypes in this phase so that a solution isn’t over-engineered, or that too much time is invested into one attempt.
When a paper prototype has reached a level of completeness, the data scientist can begin working on a higher quality solution making sure to include the customer along the journey of development.

In conclusion, when design thinking is used in conjunction with CRISP-DM, the data scientist stands to dramatically increase the chance of the project succeeding due to a better understanding of the customer’s problems and a higher buy-in from the end user due to their participation in discovering the solution. While every project doesn’t fit into one cookie cutter shape of how to best apply a style of management, there’s no denying that employing Design Thinking methodology is an incredibly useful tool to keep in a data scientist’s back pocket.